Decomposing drivers in avian insectivory: Large‐scale effects of climate, habitat and bird diversity
Abstract
Aim
Climate is a major driver of large-scale variability in biodiversity, as a likely result of more intense biotic interactions under warmer conditions. This idea fuelled decades of research on plant-herbivore interactions, but much less is known about higher-level trophic interactions. We addressed this research gap by characterizing both bird diversity and avian predation along a climatic gradient at the European scale.
Location
Europe.
Taxon
Insectivorous birds and pedunculate oaks.
Methods
We deployed plasticine caterpillars in 138 oak trees in 47 sites along a 19° latitudinal gradient in Europe to quantify bird insectivory through predation attempts. In addition, we used passive acoustic monitoring to (i) characterize the acoustic diversity of surrounding soundscapes; (ii) approximate bird abundance and activity through passive acoustic recordings; and (iii) infer both taxonomic and functional diversity of insectivorous birds from recordings.
Results
The functional diversity of insectivorous birds increased with warmer climates. Bird predation increased with forest cover and bird acoustic activity but decreased with mean annual temperature and functional richness of insectivorous birds. Contrary to our predictions, climatic clines in bird predation attempts were not directly mediated by changes in insectivorous bird diversity or acoustic activity, but climate and habitat still had independent effects on predation attempts.
Main Conclusions
Our study supports the hypothesis of an increase in the diversity of insectivorous birds towards warmer climates but refutes the idea that an increase in diversity would lead to more predation and advocates for better accounting for activity and abundance of insectivorous birds when studying the large-scale variation in insect-tree interactions.
Check the full text
Schillé, L., Valdés‐Correcher, E., Archaux, F., Bălăcenoiu, F., Bjørn, M. C., Bogdziewicz, M., ... & Castagneyrol, B. (2024). Decomposing drivers in avian insectivory: Large‐scale effects of climate, habitat and bird diversity. Journal of Biogeography, 51(6), 1079-1094.
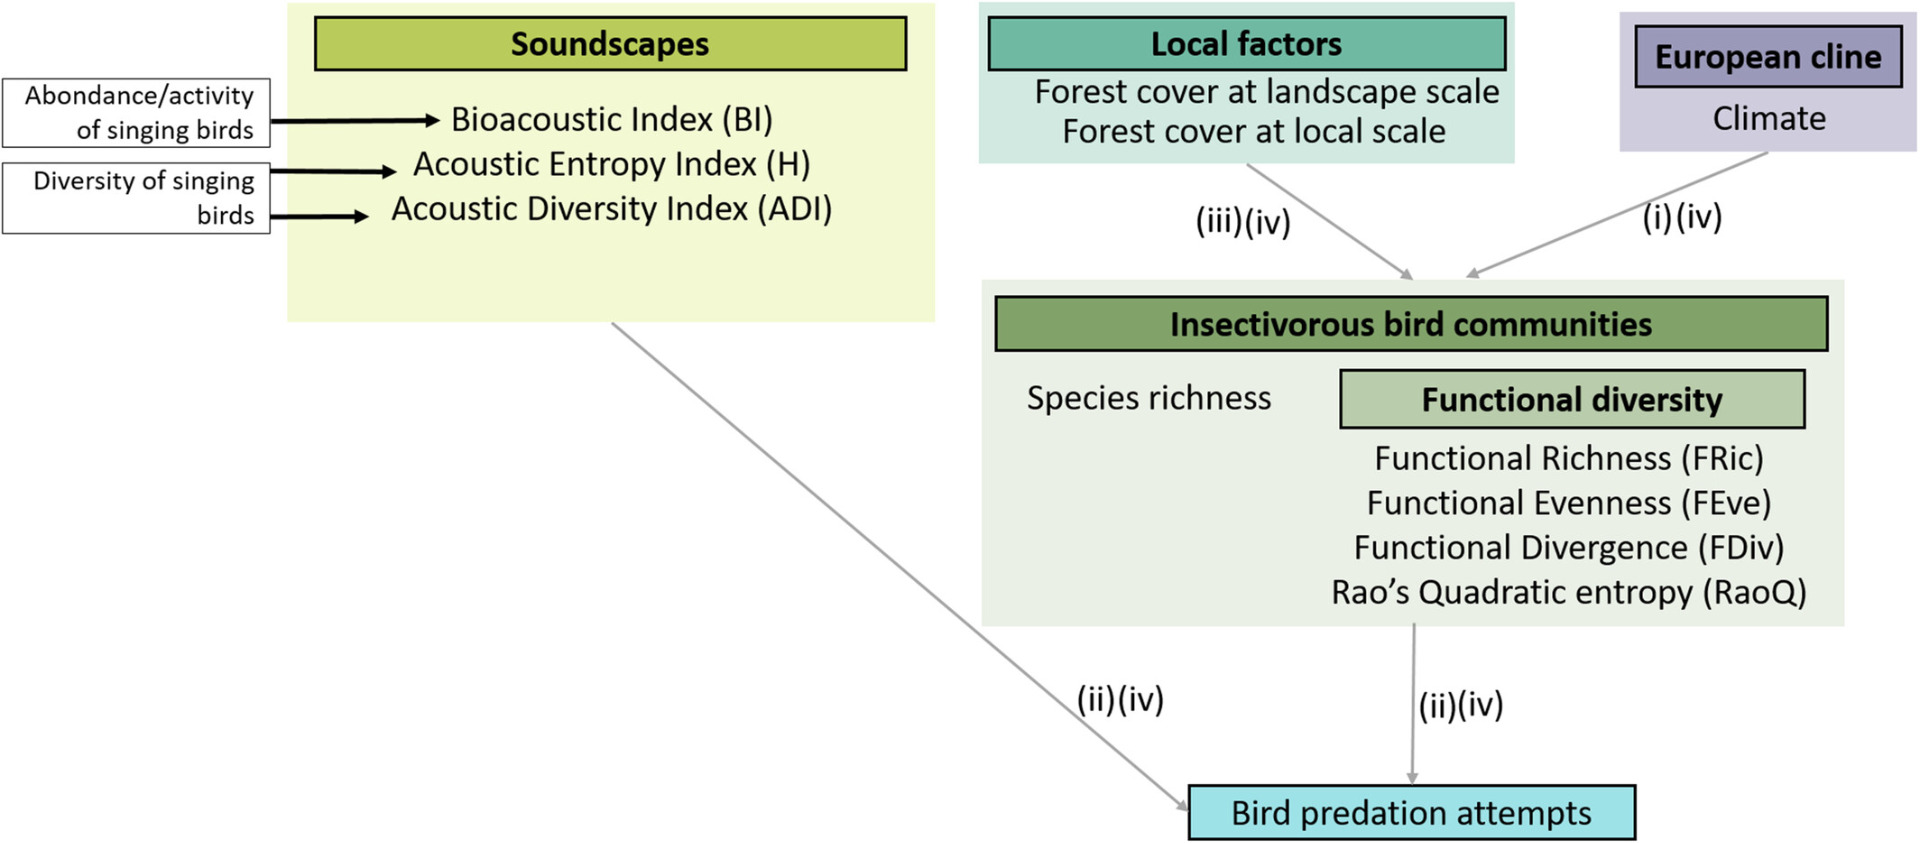
Figure 1. Conceptual diagram of the predictions of this study and the relationships already established in the literature. Boxed elements written in bold correspond to the main categories of variables tested; they are not variables as such. Variables used in models are shown in regular font. Where several variables described the same category (e.g. BI, ADI, H, all describing acoustic indices), we used multi-model comparisons to identify the best variable. Items framed in black on a white background represent untested variables. Black arrows indicate relationships well supported by the literature (see Gasc et al., 2018; and Figure 2 Sánchez-Giraldo et al., 2021). Our specific predictions are represented with grey arrows, and solid and dashed lines represent positive and negative (predicted) relationships. Numbers refer to predictions as stated in the main text.
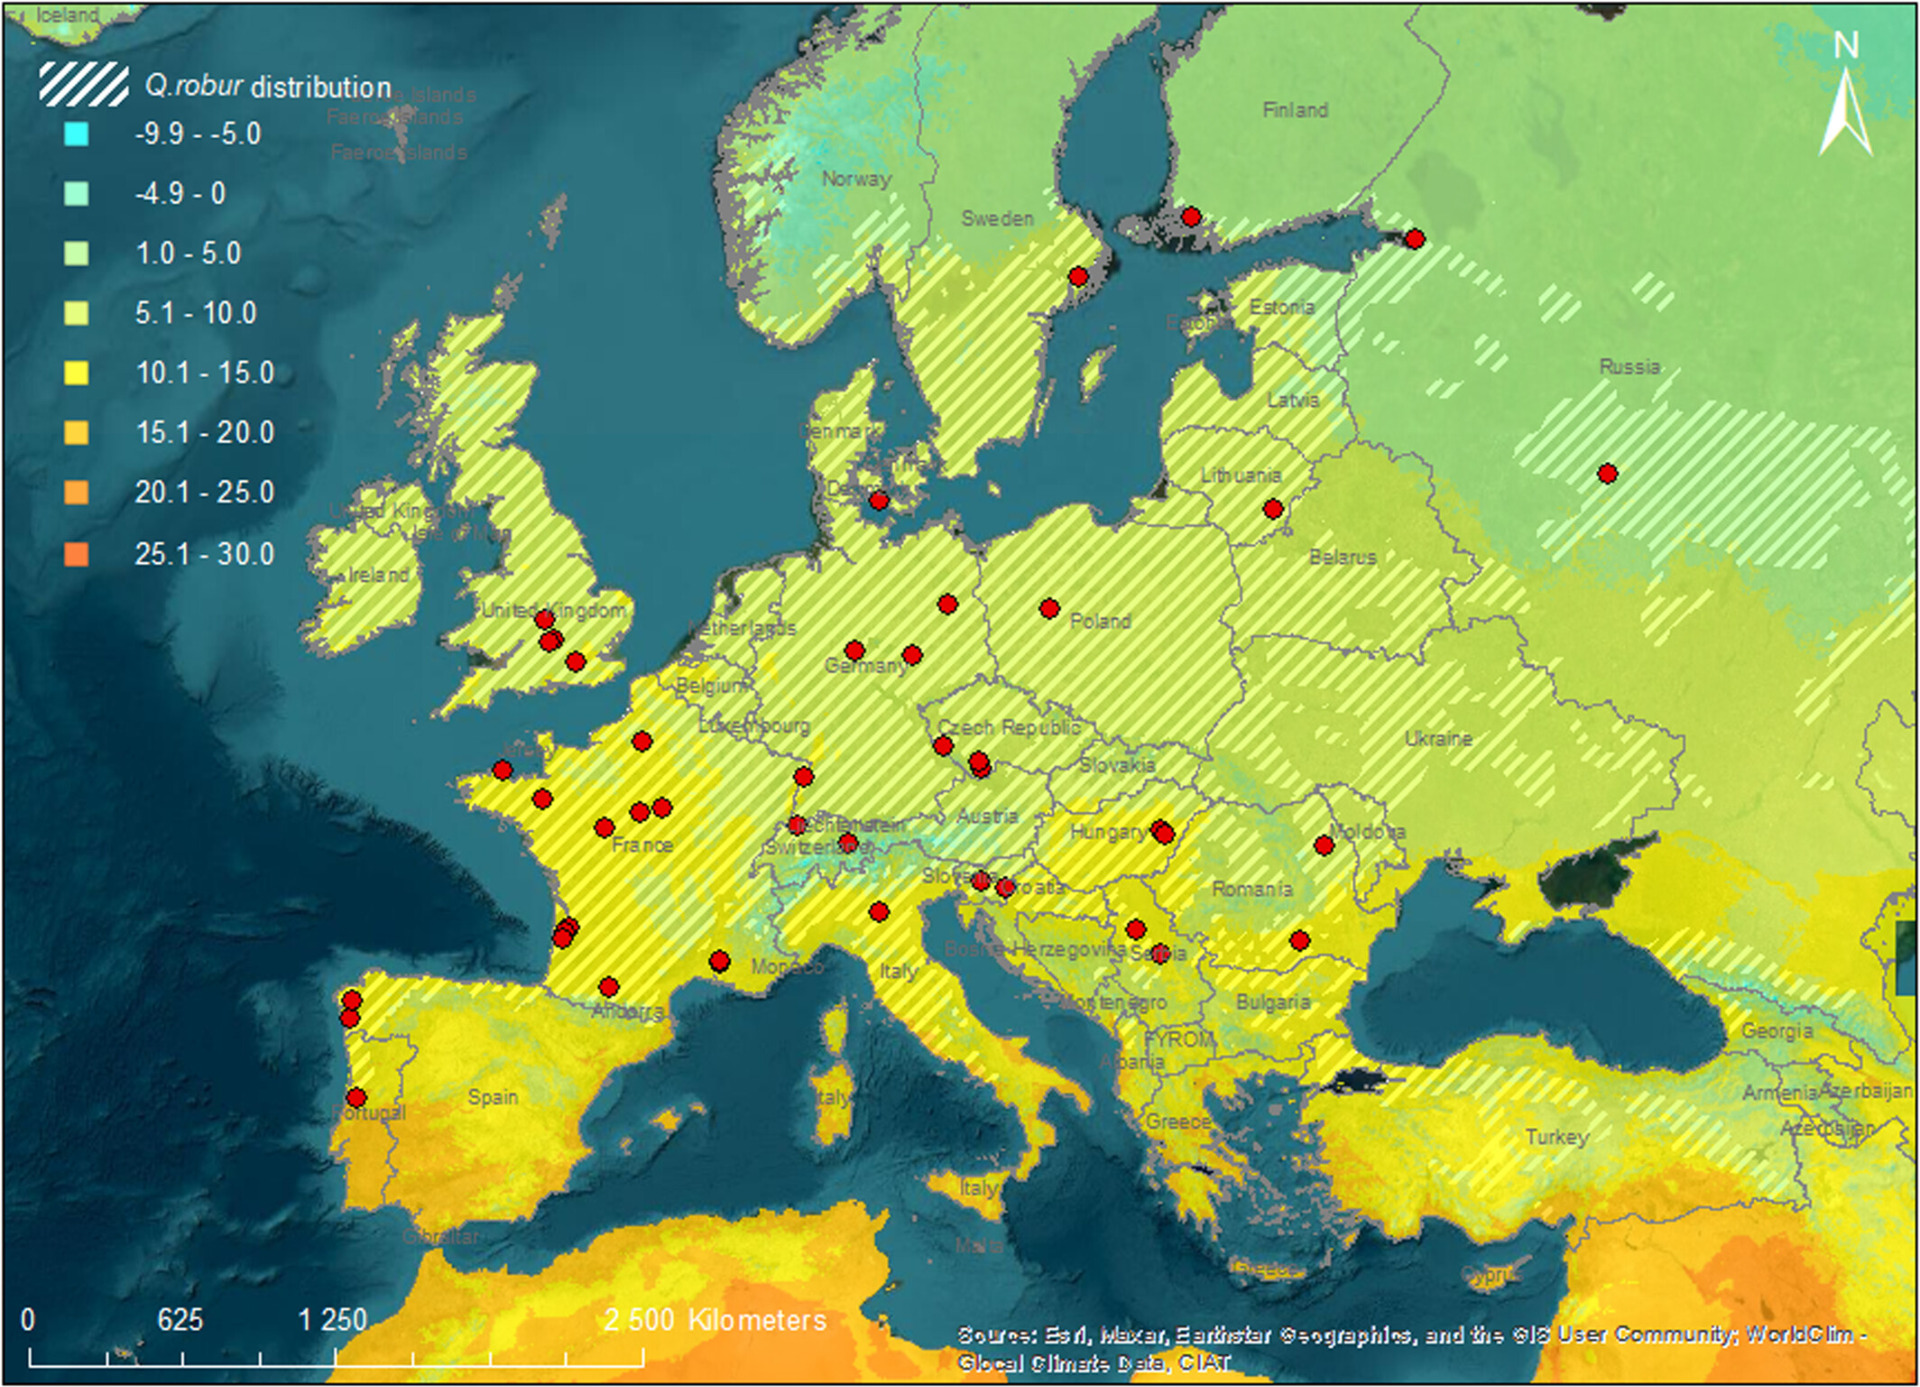
Figure 2. Locations of the 47 sites sampled in spring 2021. Average annual temperature (colour scale) according to WorldClim (Hijmans et al., 2005) and Quercus robur distribution range are indicated.
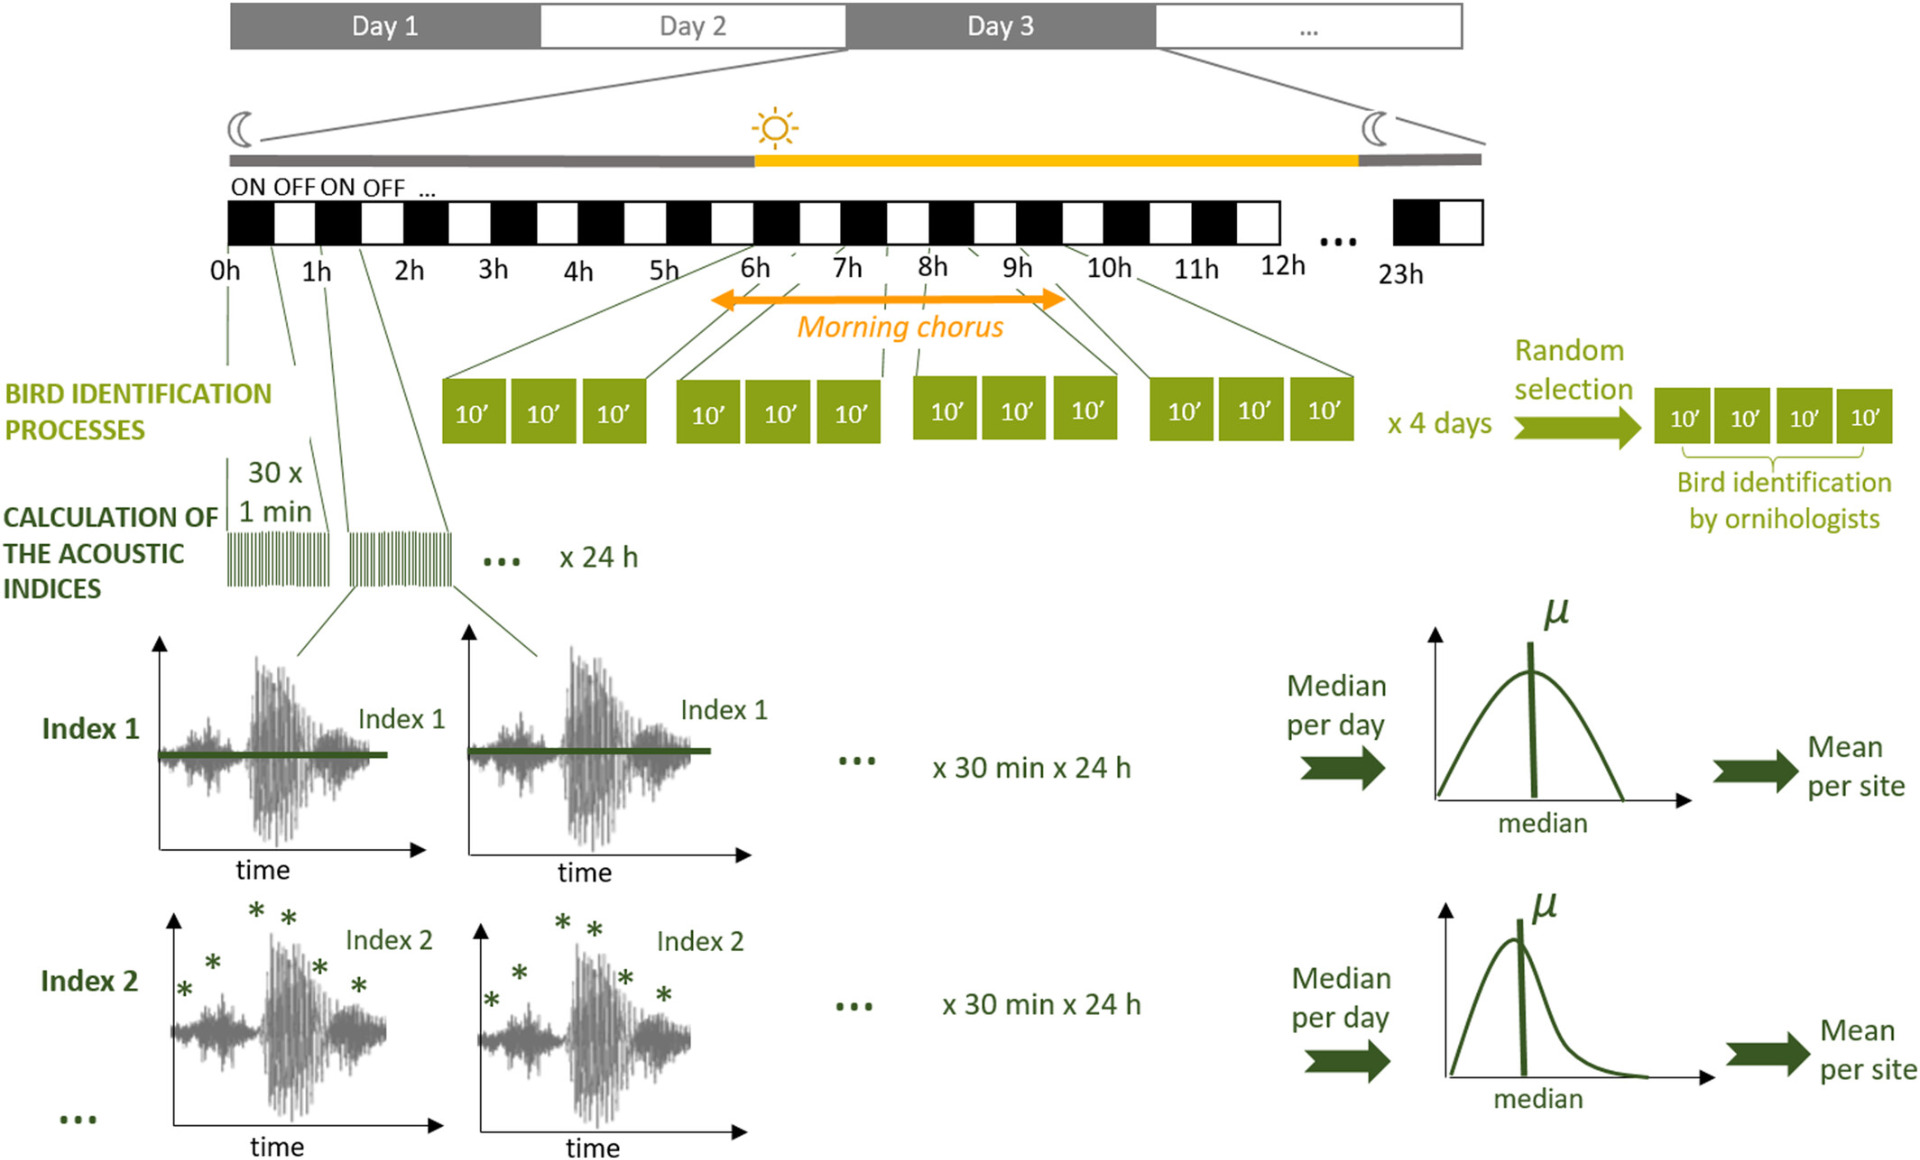
Figure 3. Methodological pathway used to identify bird species (in light green) and calculate acoustic indices (in dark green) from automated recordings (see text for details).
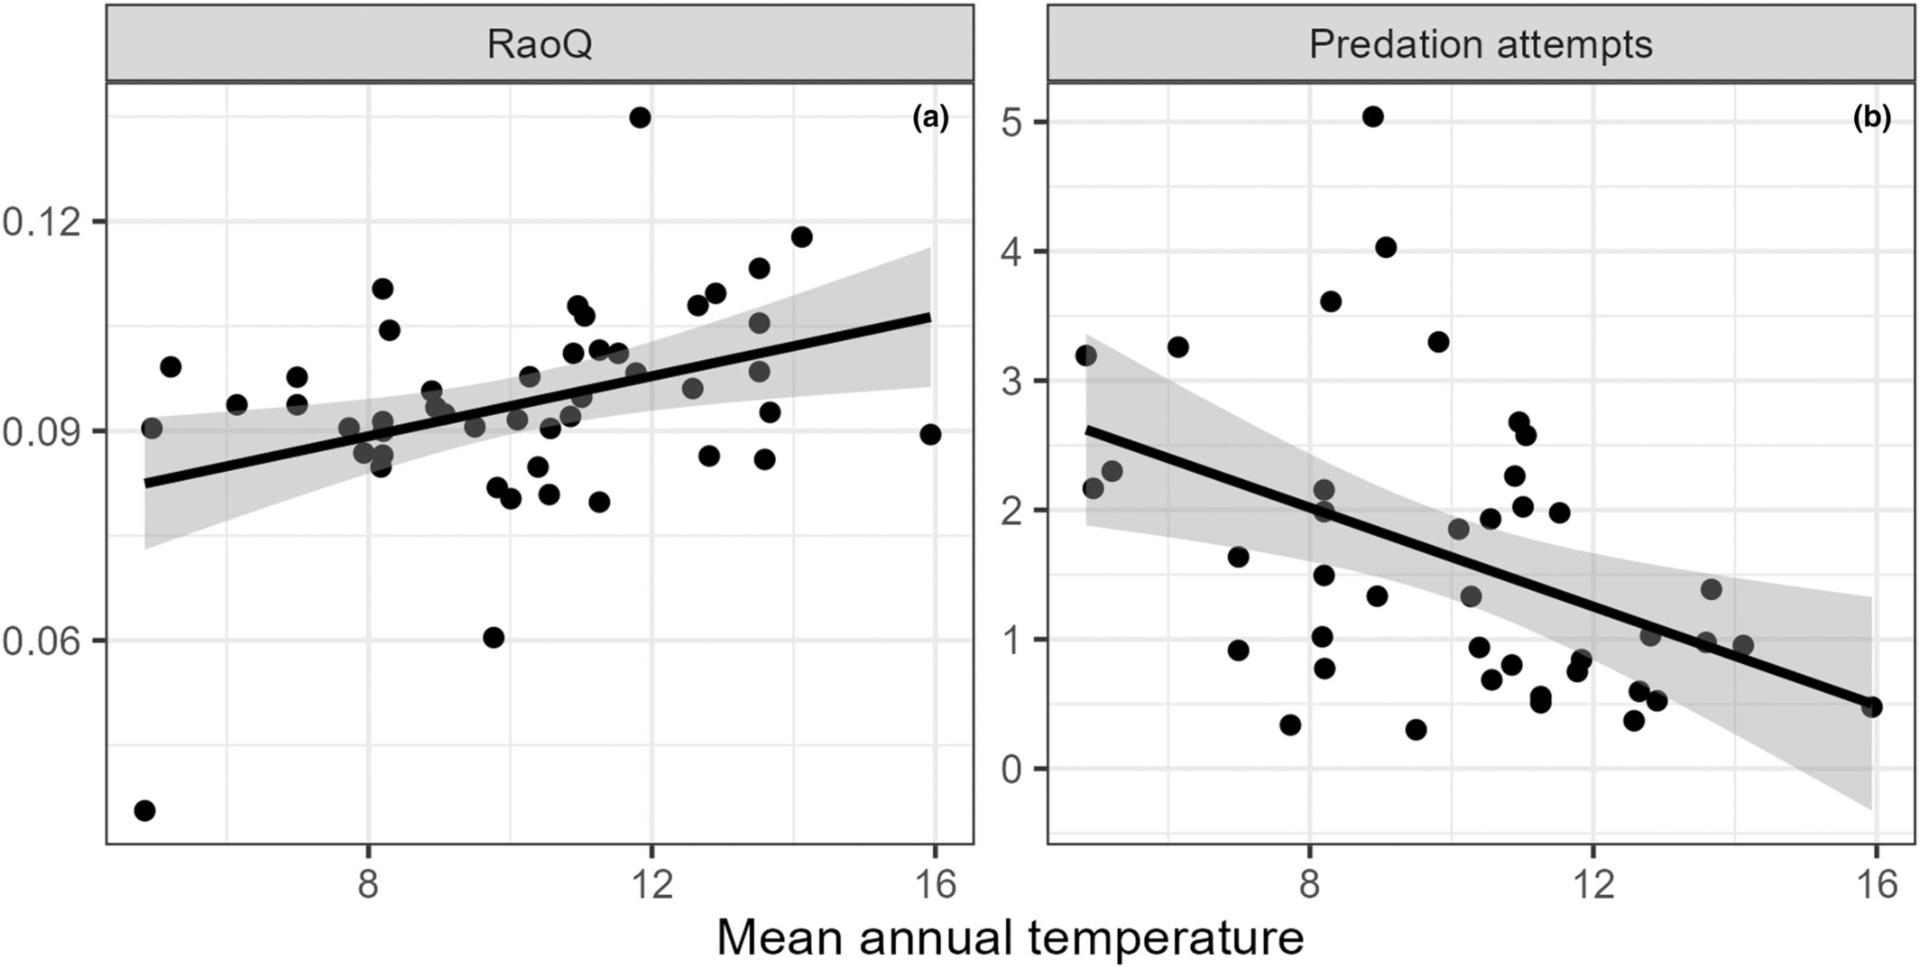
Figure 4. Scatter diagrams showing changes in (a) Rao's quadratic entropy (Rao's Q) and (b) predation attempts with mean annual temperature. These relationships were identified as significant in the linear models tested. A dot represents a site, the prediction line corresponds to a linear regression between the two variables and the grey bands represent the confidence intervals around this regression.
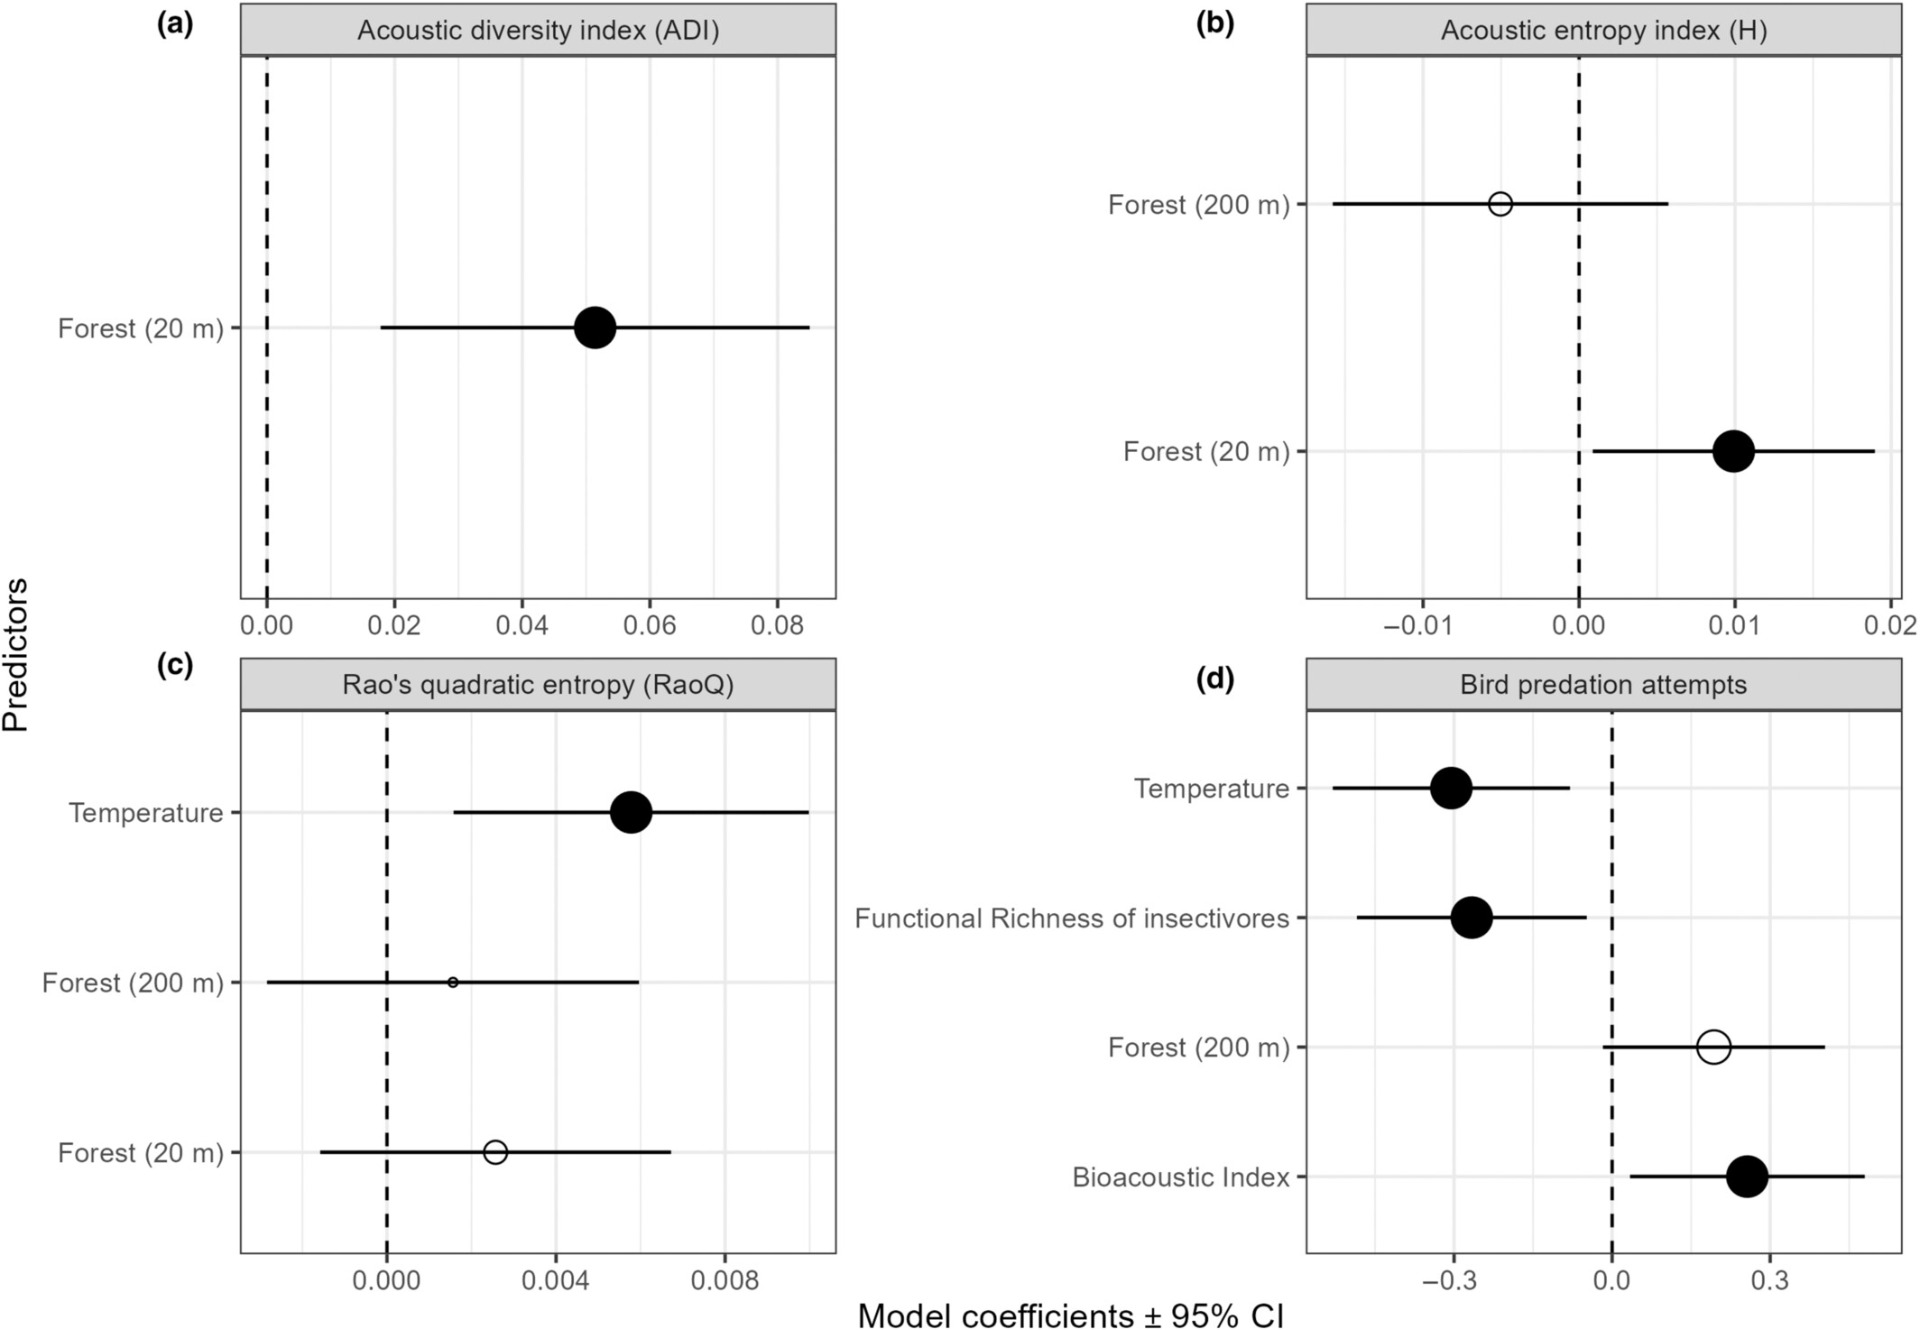
Figure 5. Effects of climate (described by the mean annual temperature) and habitat (percentage of forest cover at 20 or 200 m) on Acoustic Diversity Index (ADI) (a), Acoustic Entropy Index (H) (b), Rao's quadratic entropy (RaoQ) (c), bird predation attempts (d) and effects of acoustic (Bioacoustic Index), bird diversity (Functional Richness) on bird predation attempts (d). Circles and error bars represent standardized parameter estimates and corresponding 95% confidence intervals (CI), respectively. The vertical dashed line centred on zero represents the null hypothesis. Full and empty circles represent significant and non-significant effect sizes, respectively. Circle size is proportional to RVI.