Effects of climate on leaf phenolics, insect herbivory, and their relationship in pedunculate oak (Quercus robur) across its geographic range in Europe
Abstract
An increase in biotic interactions towards lower latitudes is one of the most consistent patterns in ecology. Higher temperatures and more stable climatic conditions at low latitudes are thought to enhance biotic interactions, accelerating biological evolution and leading to stronger anti-herbivore defences in plants. However, some studies report contradictory findings, highlighting the need for further investigation into the underlying mechanisms. We used a combination of field observations and feeding trials in controlled environments to investigate the effect of climate on chemical defences and insect herbivory in pedunculate oak (Quercus robur L.) throughout most of its geographic range in Europe, while controlling for physical defences. The concentration of lignin, flavonoids, and total phenolics increased significantly with temperature, whereas both field herbivory and weight of spongy moth (Lymantria dispar L.) larvae were negatively influenced by temperature. Lignin concentration positively influenced the weight of spongy moth larvae whereas it had no effect on field herbivory. We found no evidence of strong positive relationships between insect herbivory and larvae growth with leaf defences. Our study underscores the complexity of plant–herbivore interactions along climatic gradients and highlights the need for further research to disentangle these intricate relationships.
Check the full text
Valdés-Correcher, E., Kadiri, Y., Bourdin, A., Mrazova, A., Bălăcenoiu, F., Branco, M., ... & Castagneyrol, B. (2025). Effects of climate on leaf phenolics, insect herbivory, and their relationship in pedunculate oak (Quercus robur) across its geographic range in Europe. Oecologia, 207(4), 1-13.
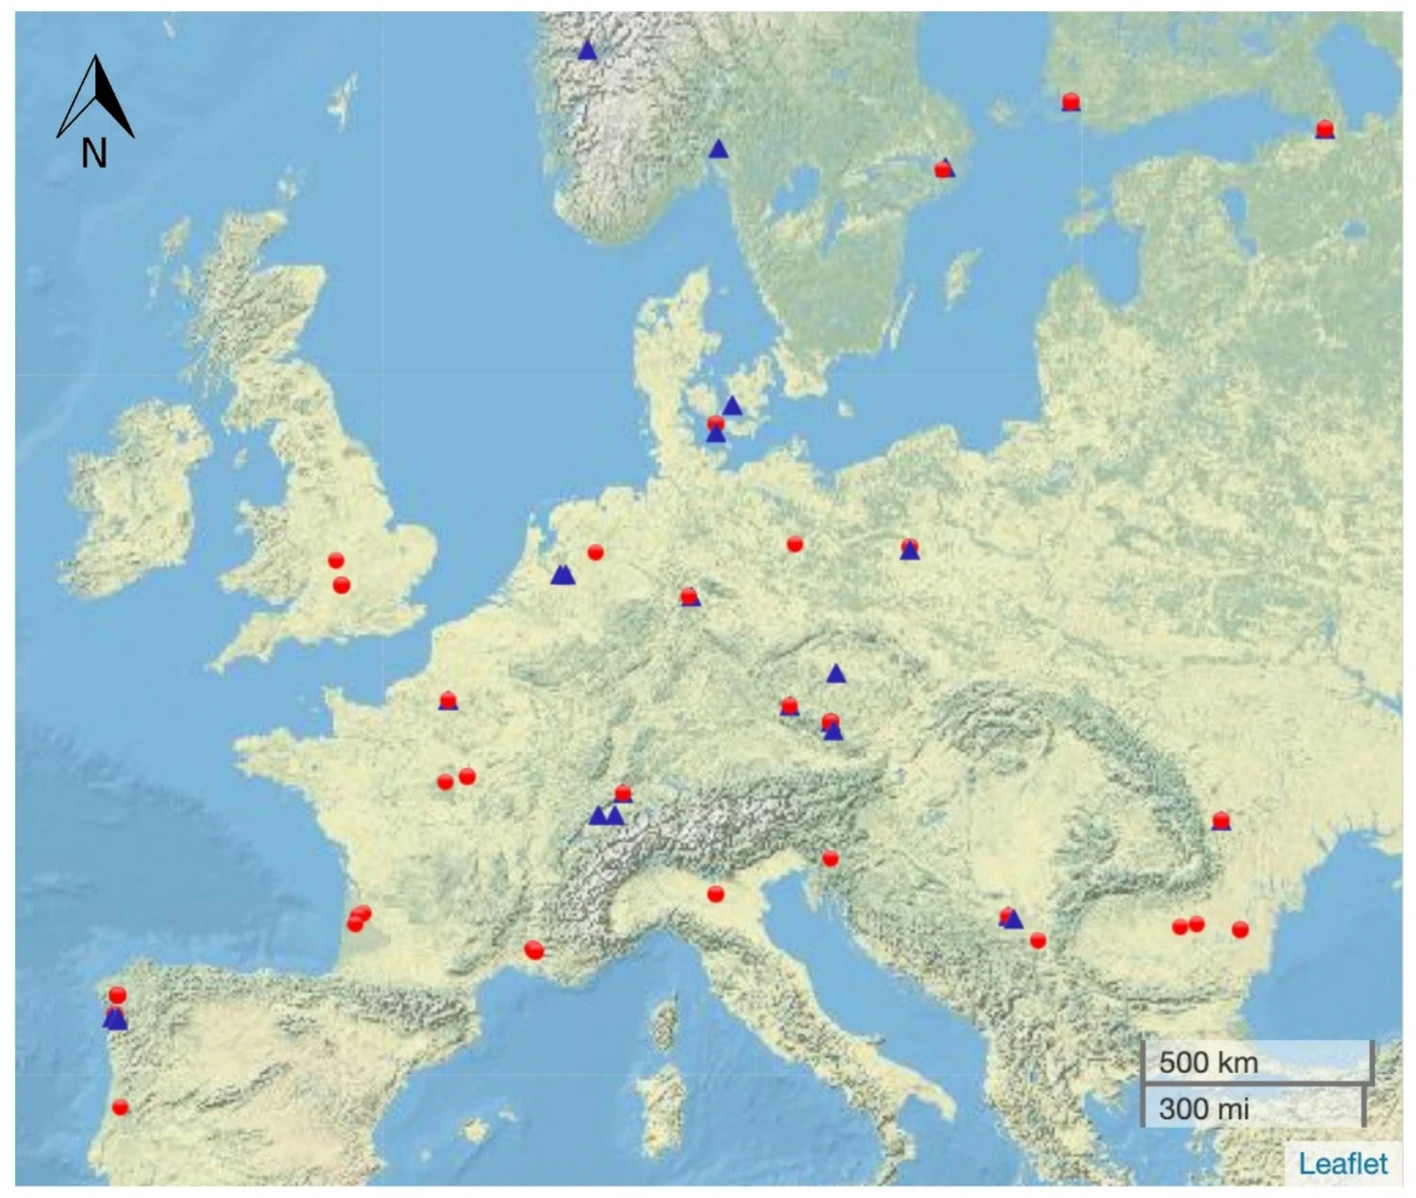
Figure 1. Locations of the trees sampled in 2020 (blue triangles) and 2021 (red circles). The map was produced using Leaflet (Cheng et al. 2021).
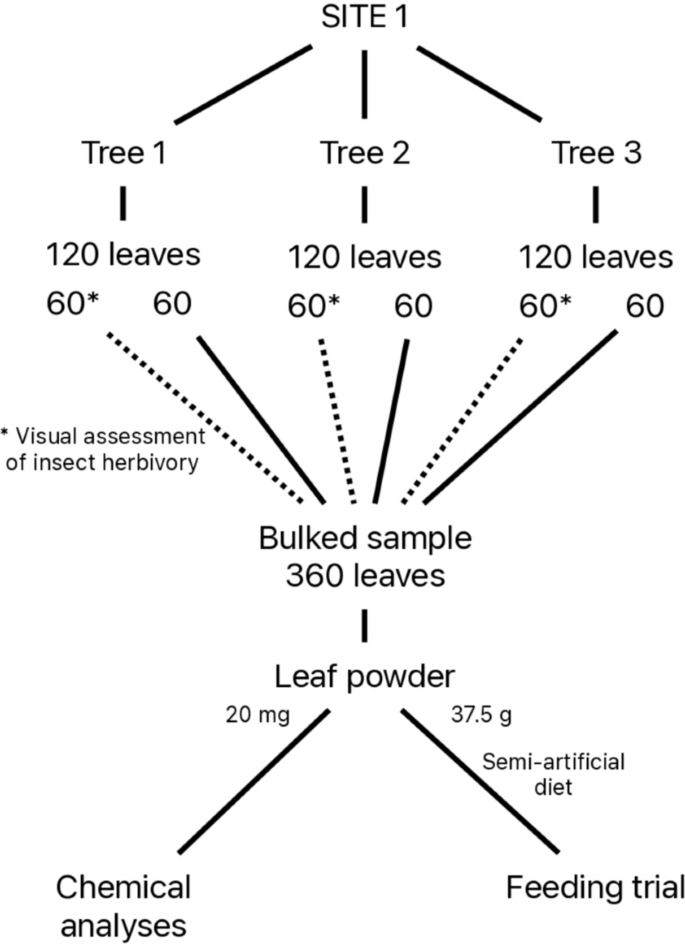
Figure 2. Schematic representation of leaf samples used for the quantification of leaf phenolics (chemical analyses), the assessment of herbivory and the laboratory feeding experiment (feeding trial).
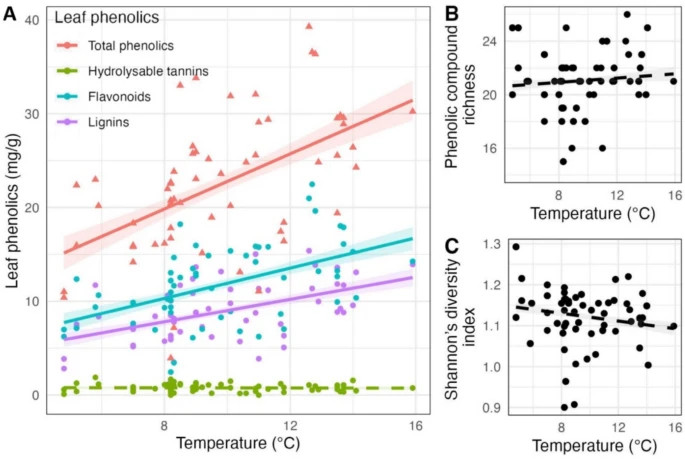
Figure 3. Effects of temperature on leaf phenolics (A: total phenolics, hydrolysable tannins, flavonoids and lignins; B: phenolic compound richness; C: Shannon diversity index). Triangle and circle shapes represent sites and correspond to total phenolics and to each of the three groups of phenolics and diversity index, respectively. Solid lines represent significant model predictions, while dashed lines represent non-significant model predictions in the linear models. Shaded areas correspond to standard errors.
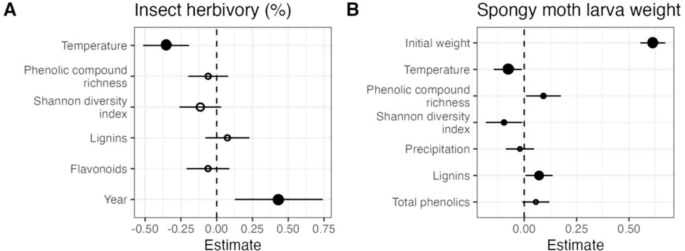
Figure 4. Effects of temperature and/or precipitation, leaf defenses (phenolic compound richness, Shannon diversity index, lignins, flavonoids and/or phenolic concentration), initial weight of the spongy moth larvae (note that initial weight was present only in the model of spongy moth weight) and year A on insect herbivory under natural conditions and B on final spongy moth larval weight under laboratory conditions. Note that only the variables retained in the selection of models are represented. Circles and error bars represent standardised parameter estimates and correspond to 95% confidence intervals (CI), respectively. The vertical dashed line centered on zero represents the null hypothesis. Full and empty circles represent significant and non- significant effect sizes, respectively. Circle size is proportional to the relative variable importance (RVI). The year 2020 is the intercept and was contrasted with the year 2021.
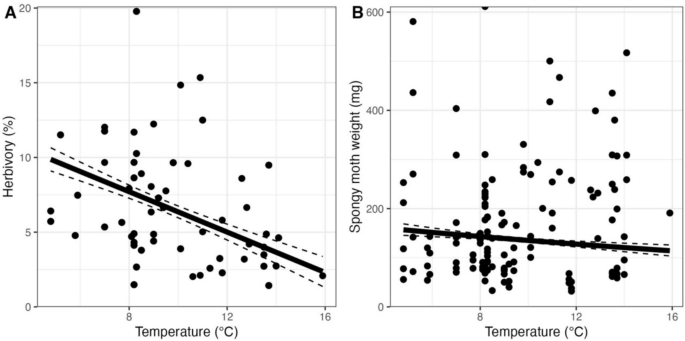
Figure 5. Effect of temperature on herbivory (A) and spongy moth weight (B). Solid and dashed lines represent model predictions and corresponding standard errors, respectively. The dots in panel A represent the average herbivory damage, calculated from 60 leaves analyzed per tree and averaged across each site, while dots in panel B correspond to the spongy moth weight of each larva (with 3 replicates per site). Only statistically significant relationships are show.